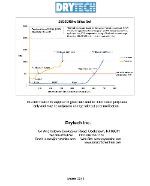
It is imperative that electrical, electronic, and optical equipment be kept moisture free to ensure proper system operation and reliability. Contaminants and moisture in compressed air or gas systems will degrade and cause failure of equipment. Below are a selection of charts that you may find useful when considering moisture issues.
Flow Rate • Pressure • Temperature Table • Gas Constants • Concentration Equivalents • Temperature Conversion • Dew Point vs Parts Per Million
| Flow Rate |
| From/to |
lit/sec |
gal/min |
ft 3 /sec |
ft 3 /min |
bbl/hr |
bbl/day |
| lit/sec |
1 |
15.85 |
0.03532 |
2.119 |
22.66 |
543.8 |
| gal/min |
0.06309 |
1 |
0.00223 |
01337 |
1.429 |
34.3 |
| ft 3 /sec |
28.32 |
448.8 |
1 |
60 |
641.1 |
1.54X10⁴ |
| ft 3 /min |
0.4719 |
7.481 |
0.01667 |
1 |
10.69 |
256.5 |
| bbl/hr |
0.04415 |
0.6997 |
0.00156 |
0.09359 |
1 |
24 |
| bbl/day |
0.00184 |
0.02917 |
6.50X10⁻⁵ |
0.0039 |
0.04167 |
1 |
| Pressure |
| from/to |
mmHg |
in Hg |
in H20 |
ft H 2 0 |
atm |
lb/in 2 |
kg/cm 2 |
| mmHg |
1 |
0.03937 |
0.5353 |
0.446 |
0.00132 |
0.01934 |
0.00136 |
| in Hg |
25.4 |
1 |
13.6 |
1.133 |
0.03342 |
0.4912 |
0.03453 |
| in H 2 0 |
1.868 |
0.07355 |
1 |
0.08333 |
0.00246 |
00.03613 |
0.00254 |
| ftH 2 0 |
22.42 |
0.8826 |
12 |
1 |
0.0295 |
0.4355 |
0.03048 |
| atm |
760 |
29.92 |
406.08 |
33.9 |
1 |
14.7 |
1.033 |
| lb/in 2 |
51.71 |
2.036 |
27.67 |
2.307 |
0.06805 |
1 |
0.07031 |
| kg/cm 2 |
735.6 |
28.96 |
393.7 |
32.81 |
0.9678 |
14.22 |
1 |
| Temperature |
| ° C |
° F |
° C |
° F |
° C |
° F |
° C |
° F |
| -273.15 |
-459.67 |
25 |
77 |
240 |
464 |
540 |
1004 |
| -260 |
-436 |
30 |
86 |
250 |
482 |
550 |
1022 |
| -240 |
-400 |
35 |
95 |
260 |
500 |
560 |
1042 |
| -220 |
-364 |
40 |
104 |
270 |
518 |
570 |
1058 |
| -200 |
-328 |
45 |
113 |
280 |
536 |
580 |
1076 |
| -180 |
-292 |
50 |
122 |
290 |
554 |
590 |
1094 |
| -160 |
-256 |
55 |
131 |
300 |
572 |
600 |
1112 |
| -140 |
-220 |
60 |
140 |
310 |
590 |
610 |
1130 |
| -120 |
-184 |
65 |
149 |
320 |
608 |
620 |
1148 |
| -100 |
-148 |
70 |
158 |
330 |
626 |
630 |
1166 |
| -80 |
-112 |
75 |
167 |
340 |
644 |
640 |
1184 |
| -70 |
-94 |
80 |
176 |
350 |
662 |
650 |
1202 |
| -65 |
-85 |
85 |
185 |
360 |
680 |
660 |
1220 |
| -60 |
-76 |
90 |
194 |
370 |
698 |
670 |
1238 |
| -55 |
-67 |
95 |
203 |
380 |
716 |
680 |
1256 |
| -50 |
-58 |
100 |
212 |
390 |
734 |
690 |
1274 |
| -45 |
-49 |
110 |
230 |
400 |
752 |
700 |
1292 |
| -40 |
-40 |
120 |
248 |
410 |
770 |
710 |
1310 |
| -35 |
-31 |
130 |
266 |
420 |
788 |
720 |
1328 |
| -30 |
-22 |
140 |
284 |
430 |
806 |
730 |
1346 |
| -25 |
-13 |
150 |
302 |
440 |
824 |
740 |
1364 |
| -20 |
-4 |
160 |
320 |
450 |
842 |
750 |
1382 |
| -15 |
5 |
170 |
338 |
460 |
860 |
760 |
1400 |
| -10 |
14 |
180 |
356 |
470 |
878 |
770 |
1418 |
| -5 |
23 |
190 |
374 |
480 |
896 |
780 |
1436 |
| 0 |
32 |
200 |
392 |
490 |
914 |
790 |
1454 |
| 5 |
41 |
210 |
410 |
500 |
932 |
800 |
1472 |
| 10 |
50 |
212 |
414 |
510 |
950 |
810 |
1490 |
| 15 |
59 |
220 |
428 |
520 |
968 |
820 |
1508 |
| 20 |
68 |
230 |
446 |
530 |
986 |
830 |
1526 |
| Gas Constants |
| Numerical Constant |
Value |
Unit of Measurement |
| Volume of Ideal Gas at STP |
22.414 L |
Liters, 0°C, 1 atm. |
| Volume of Ideal Gas at NTP |
24.416 L |
Liters, 70°F, 1 atm. |
| Avogadro’s Number |
6.0221367 x 10²³ |
molecules/gm-mole |
| Desnity of Air (STP) |
1.2928 |
grams/liters |
| Gas Law Constant, R |
1.98719 |
cal/(gm-mol)(°K) |
|
82.568 |
(cm 3 )(atm)/(gm-mol)(°K) |
| Concentration Equivalents |
| Multiply |
ppt |
ppb |
ppm |
% |
| parts per trillion, ppt |
1 |
0.001 |
0.000001 |
1.00E-10 |
| parts per billion, ppb |
1,000 |
1 |
0.001 |
1E-07 |
| parts per million, ppm |
1,000,000 |
1,000 |
1 |
0.0001 |
| Percent, % |
10,000,000,000 |
10,000,000 |
10,000 |
1 |
| Temperature Conversion |
| Multiply |
°C, Celsius |
°F, Fahrenheit |
°K, Kelvin |
°R, Rankin |
| Celsius, °C |
1 |
9/5(C) + 32 |
°C + 273.15 |
(°C +273.15)1.8 |
| Fahrenheit, °F |
(°F-32)(5/9) |
1 |
(°F-32)(5/9)+273.115 |
°F + 459.67 |
| Kelvin, °K |
°K-273.15 |
(°K-273.15)1.8+32 |
1 |
(°K)1.8 |
| Rankin, °R |
(°R/1.8)-273.15 |
°R-459.67 |
°R/1.8 |
1 |
| Moisture in Gases – Approximate Relationships |
| Dewpoint |
PPM on Volume Basis |
| °C |
°F |
| -90 |
-130 |
.0923 |
| -88 |
-126 |
.134 |
| -66 |
-123 |
.184 |
| -84 |
-119 |
.263 |
| -82 |
-116 |
.382 |
| -78 |
-112 |
.526 |
| -76 |
-108 |
.747 |
| -74 |
-105 |
1.01 |
| -72 |
-101 |
1.38 |
| -70 |
-98 |
1.88 |
| -68 |
-94 |
2.55 |
| -66 |
-90 |
3.44 |
| -64 |
-87 |
4.60 |
| -62 |
-83 |
6.10 |
| -60 |
-80 |
8.07 |
| -58 |
-78 |
10.6 |
| -56 |
-72 |
14.0 |
| -54 |
-69 |
18.3 |
| -52 |
-65 |
23.4 |
| -50 |
-62 |
31.1 |
| -48 |
-58 |
39.4 |
| -46 |
-54 |
49.7 |
| -44 |
-51 |
49.7 |
| -42 |
-47 |
63.2 |
| -40 |
-44 |
80.0 |
| -38 |
-40 |
101. |
| -36 |
-36 |
127. |
| -34 |
-33 |
159. |
| -32 |
-29 |
198. |
| -30 |
-26 |
249. |
| -28 |
-22 |
309. |
| -26 |
-18 |
376. |
| -24 |
-15 |
462. |
| -22 |
-11 |
566. |
| -20 |
-8 |
691. |
| -18 |
-4 |
841. |
| -15 |
0 |
1,020. |
| -14 |
+3 |
1,230. |
| -12 |
+7 |
1,490. |
| -10 |
+10 |
1,790. |
| -8 |
+14 |
2,140. |
| -6 |
+18 |
2,560. |
| -4 |
+21 |
3,060. |
| -2 |
+25 |
3,640. |
| 0 |
+28 |
4,320. |
| +2 |
+32 |
5,100. |
| +4 |
+36 |
6,020. |
| +6 |
+39 |
7,060. |
| +8 |
+42 |
8,130. |
| +10 |
+46 |
9,370. |
| +12 |
+50 |
10,720. |
| +14 |
+54 |
12,280. |
| +16 |
+57 |
14,140. |
|
+60 |
15,980. |
|
|
18,160 |